Skip navigation

Category Archives: Uncategorized

I have been playing around with arduinos and electronics for a few years now, but progress on projects has been really slow.  While I have had some fun with the hobby and have learned a lot, the pace of progress can be very frustrating at times.  Between not having the right parts on hand, to spending whole weekends troubleshooting issues with the hardware or sensors, it can feel like for every step forward, I take two steps back.

Case in point, a few weeks ago I finally got around to working on a minibot kit that I had bought from sparkfun a few years earlier.  When I first got the kit, I ran into an issue with the FTDI chip in the board.  After some back and forth with Sparkfun’s customer service, we determined that it was a faulty board, and they were kind enough to send out a replacement.  At the time I did not have a desoldering pump, so when the replacement board arrived I spent a number of hours struggling to remove components from the original board until I finally gave up in frustration and ordered a desoldering pump online.  In the two weeks it took for the pump to arrive, other priorities pulled my attention away from the kit and it ended up getting stashed into storage with all my other half completed projects.

After a few years of the kit sitting in storage, I finally decided to give it another go.  I ordered a few parts that I thought would make for good upgrades, I pulled off the components of the old board, and soldered them to the replacement board.  I plugged in the battery and set the bot on the ground and … silence….

The board had come with a sketch preloaded on the microcontroller, but for some reason the program was not running.  I attempted to revive the board by uploading a copy of the original sketch.  And of course I got an error: avrdude: stk500_getsync(): not in sync: resp 0x00.  Ugghhh.

The next week I spent a few hours searching the internet for a possible solution.  Finding solutions for hardware problems can be tricky because the specific errors that you get can be very dependent on the components and configuration that you are using in your project, and because hardware issues often have multiple possible causes (bad configuration, faulty connections, bad/broken components, etc…).  After crossing off a few of the more obvious potential causes, I stumbled across this post.  The commenter was having similar issues as I was and was able to solve the problem by uploading a new bootloader to the board.  While the solution looked promising I was a bit nervous about attempting the fix because the solution involved using a second arduino to act as an ISP Programmer in order to burn a new bootloader to the malfunctioning microcontroller.

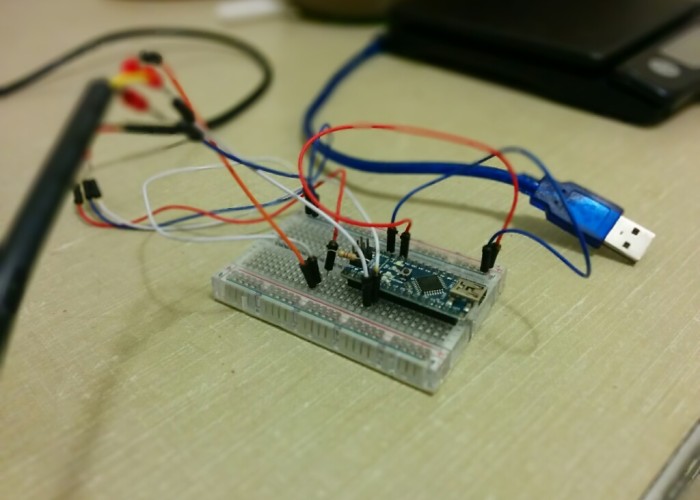
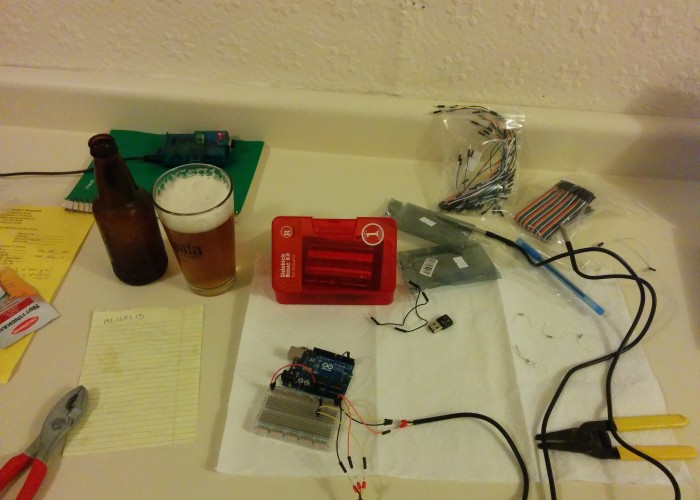
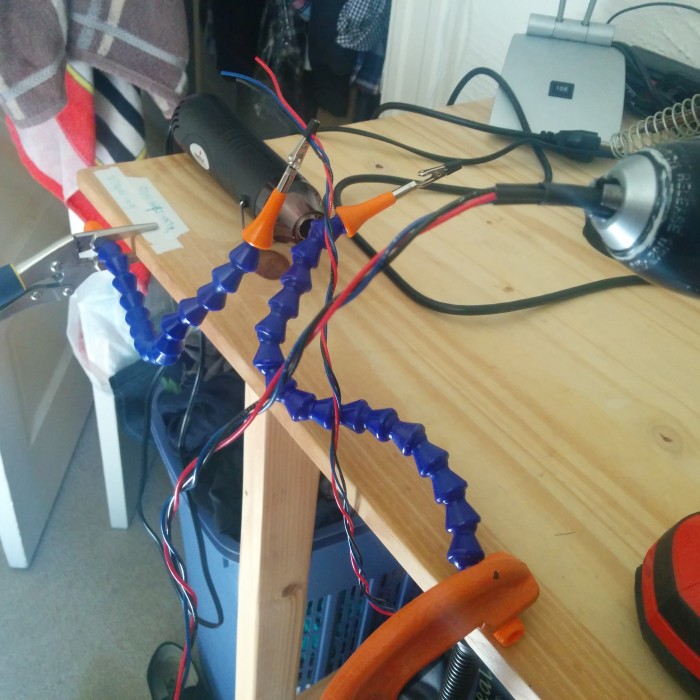
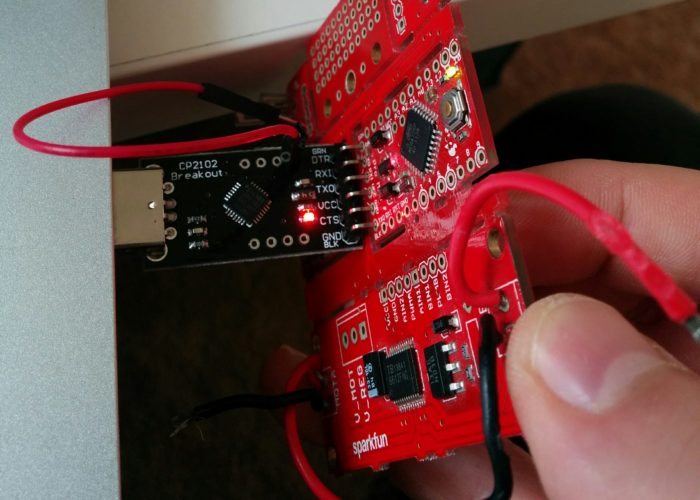
  • Hooking up an FTDI chip to the original board. Probably would have been a good idea to solder on some headers, loose connections make for precarious situations

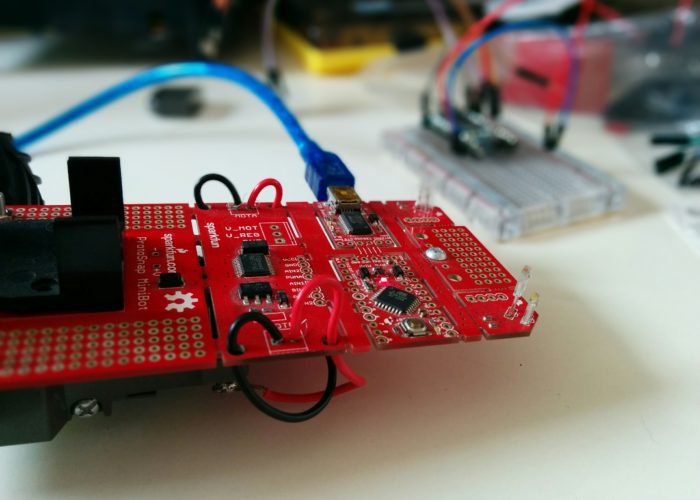
Considering the complexity of the solution I was concerned that I could permanently damage the board somehow.  Fortunately, I still had the original board that came with the kit, and as far as I knew the microcontroller on that board was still functional (during my back and forth with Sparkfun, we had came to the conclusion that it was the onboard FTDI chip that was malfunctioning).  I hooked up the old board to a working FTDI chip, bypassing the broken onboard chip and tested to see if I would get the same error.  And as luck would have it, the sketch failed to load (one of the few times I was glad to see an error pop up).

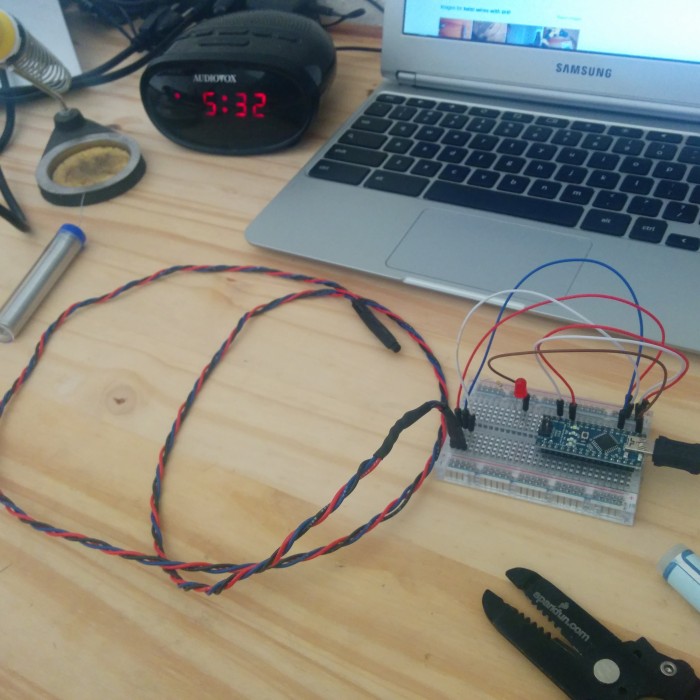
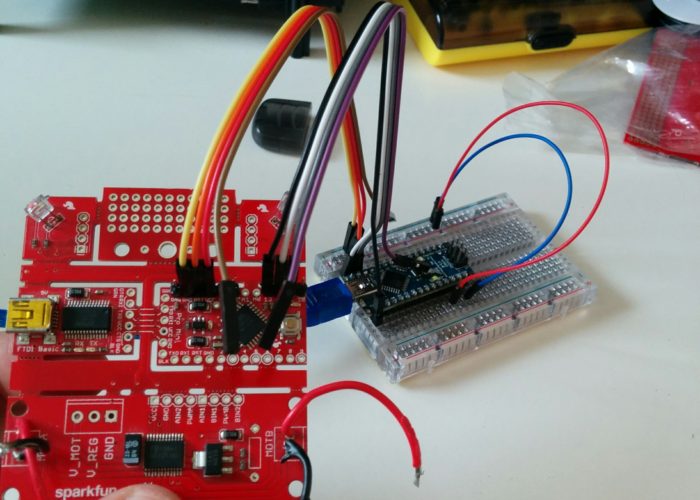
Once I had confirmed that the old board had the same issue as the replacement board, I configured an Arduino UNO to act as a programmer and hooked it up to the microcontroller.  I initiated the bootloader burn and the moment following was best described by rubinoe, the commenter who posted the solution on the sparkfun forums:

This was a magical moment for me. All kinds of LEDS were blinking and flashing. After a few seconds the IDE said: Done burning bootloader, thank you. …. I was so excited that this worked I let my wife sucker me into going to the arts and crafts store so she could buy some new sewing thread. Don’t fall for this.

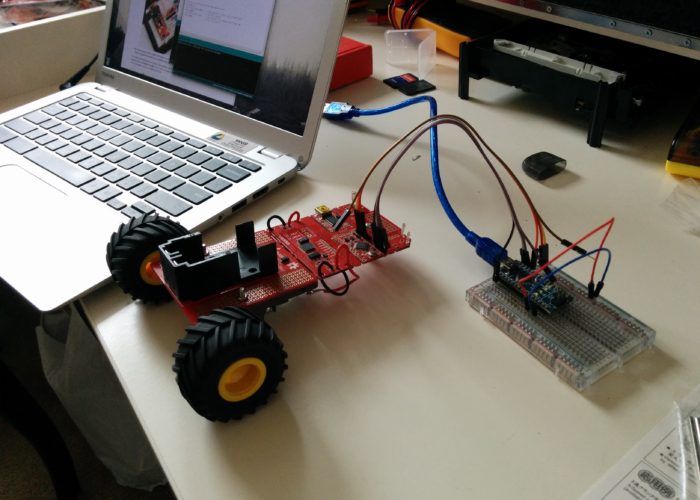
I confirmed that it had worked by hooking up the board to the FTDI chip and loading up a blink sketch.  I then repeated the bootloader burning process with the fully functional board and was much relieved when I was finally able to load the example minibot sketch and watch the bot skitter across the floor and clumsily and unsuccessfully attempt to avoid objects.

So there I was, many hours of work invested, and a few years since I had originally purchased the kit, and I finally had a working bot.  And of course I still haven’t gotten around to any of the planned upgrades and improvements[1] in the weeks since I made this fix.  Part of me is glad for the learning experiences that I had while trying to get things working, and now that I know how to bypass the FTDI on the broken board, I can part that board out and use it to build a second bot.  But part of me is really frustrated that it has taken this long to get the bot to where it currently is.  It’s mostly my fault for not pushing things forward, but when solving simple errors can consume an entire weekend, I guess I shouldn’t be too hard on myself for not getting things done faster.  Anyways, back to procrastinating!

[1] My plans are to add remote control (via wifi or radio), some additional sensors, and upgrade to a tank chassis.  I will try and post about these improvements when I finally get around to them.


I have been meaning to post about this topic for awhile, but due to work and life I haven’t had the time or energy to write posts for this blog.  Anyways, let’s get to it.

About two or three years ago I was just getting started with python.  I had a few little python projects I was working on and was starting to explore the data analysis tools in the python ecosystem.  I stumbled across the Anaconda python distribution which offers a python distribution and packaging system that comes with all of the non-python dependencies required by many of the data analysis focused packages (matplotlib, numpy, etc…).  Having recently experienced some of the struggles of getting up and running with these packages, I decided to give Anaconda a try.  After all, what is the worst that can happen….

The installation was fairly painless, just download the installer, run the bash script and respond to the questions when prompted. Accepting the ‘Terms and Conditions’ was a little annoying[1], but overall it was a pretty painless install and before I knew it I was up and running with ipyhton notebook, matplotlib, and pandas.  It was nice that everything just worked out of the box, and the environment and package management systems seemed to be pretty cool.  After playing around with Anaconda for a bit, I decided to switch back to working on one of my python projects and to my dismay, nothing was working!

After a very long and frustrating afternoon, I eventually figured out that I had accidentally allowed the Anaconda installer to prepend the path of the anaconda distribution into my .bashrc file.  So when I tried to run my python existing python projects (all of which were in virtualenvs)  I got errors related to the python version that was being used (can’t re-call the exact errors, it’s been awhile).  After some more time of trying to figure out a way to get virtualenvs to work within conda (Anaconda’s environment isolation tool), I decided to just uninstall Anaconda and restore my original .bashrc.

It’s worth mentioning that not only was a fairly new to python, but I was also fairly new to Linux at the time as well.  Had I been a little more experienced, I would have known that I could just restore the original .bashrc file without uninstalling Anaconda, and things would have returned to normal for my existing python projects.  I eventually settled on a sub-optimal solution where i installed Anaconda into a separate chroot (essentially a sandboxed OS).  As such, I never really used it that much due to the difficulty switching between the two environments.

A year or two later, I got a job as a data engineer with a solar analytics company.  While most of my work involves building out a data warehouse, occasionally I do some analytical work where Anaconda would be very useful.  So after some digging on the interwebs, I stumbled across a few blog posts that provided what seemed like a good solution.  In hindsight, this should have been obvious, but essentially the solution is to tell Anaconda ‘No’ when it asks to prepend the path to .bashrc, and after the isntallation is complete, add a few lines to your .bash_profile (on Mac) that allows you to jump into Anaconda.  The line I use is:


alias enterconda='export PATH="/Users/pyoung/anaconda/bin:$PATH" && PS1="\u@anaconda:\w\$"'

So now when I want to use Anaconda, I just type <code>enterconda</code> in a terminal, and from there I can launch an ipython notebook sessions or drop into a python shell and have access to all of the popular python data tools.

[1] You had to scroll through the entire text of the Terms document (either using the enter key or the down key, can’t remember which), and when you got to the bottom if you didn’t release the key at the ‘Do you accept’ prompt, it would abort the installation with a message like ‘You must accept the terms and conditions in order to use Anaconda.’  Essentially it was accepting the scroll key as a valid negative input to their ‘Terms and Conditions’ prompt.  It took a few attempts to get past this (the T&C was real long, and who reads those things anyway!). 

So I mentioned in a previous post that I was getting the occasional bad reading from the DS18B20 temperature sensor that I was using to monitor beer fermentation.  I noticed the issue because I was getting very ‘choppy’ temperature profiles.  It was obvious that really low temperature values (in this case it turned out to be a value of -0.06, not sure why) were getting averaged into the temperature readings (the system averages 60 readings at an interval of approximately 1/sec, and then sends that average across the network).  While I was aware of the issue pretty soon after getting the system up and running, I was a bit pressed for time and decided to put fixing the issue on the back burner.

LoggerIssue

Example of the impact of the bad reads. Every few minutes, a bad read would get averaged into one of the data points, causing the temperature to appear lower, resulting in this ‘spiky’ profile.

Coincidentally, the issue ended up fixing itself (sort of).  After a few successful trial runs, I added an additional temperature sensor to the Arduino, and  in order to be able to identify the data coming from the two sensors, I needed to pull the serial addresses.  Turns out that the bad reads that I was getting also resulted in a bad address, so I added some code to throw out that data.

LoggerIssueFixed

Notice how the fluctuations are on the order of magnitude of ~0.1 degree F, as opposed to ~1 degree F previously. Much better!

So I should probably mention that this entire issue would have been avoided if I had just copy and pasted the Arduino sketch code for the DS18B20.   In the example code, they have a few different checks, such as a check that ensures the sensor is of the right type, as well as a CRC (cyclic redundancy check) validation.  The CRC is very similar to a checksum,the senor performs a mathematical operation on the data and then sends along the value (the CRC) of the operation.  This allows the person to verify that the data was successfully transmitted by re-performing the operation and comparing it to the CRC value.  If the values do not match, it probably means that there was an issue with sending the data across the wire.  The code in question is below.

 if ( OneWire::crc8( addr, 7) != addr[7]) {
      Serial.print("CRC is not valid!\n");
      return;
}

Had I included the above code in my sketch, this issue would have been avoided entirely.  But considering I am doing this project for fun and for the experience/education, I think writing the code from scratch is a good thing to do.  I have certainly created some unnecessary bugs with this approach, but I have also learned a lot more by not copying and pasting code.  But this is also a good lesson in making sure to inspect example and tutorial code very thoroughly to ensure that you are not leaving out anything important.  In this case, leaving out the sensor type check code (the one wire library can work with multiple digital sensor types running on the same pin) made sense because I knew I was only using a certain type of sensor.  Nut leaving out the CRC validation was a bad call.

  • Transferring the Single Hop Cascade and Single Hop Simcoe to secondary.

I brewed two more one-gallon batches of Single Hop Pale Ale.  I used Armarillo in one, and Sorachi Ace in another.  Looking forward to drinking these.  I’ve got a lot more work to do on the project, and will try and fit it in here and there, so stay tuned.

One of my goals for the fermentation temperature logging project was to be able to accommodate multiple temperature sensors running from the same Arduino, as well as handle data from multiple sensor units in different locations.  I was scheduled to brew a 5 gallon batch of beer this past Saturday, and it just so happened that I received my shipment of DS18B20 sensors that same morning.

My brewing buddy had acquired the ingredients for an Imperial Stout for our brew session. Due to the high gravity of the beer, the fermentation requires a stable temperature at a higher range of the yeast’s tolerance (~68F).  Additionally, due to the high levels of sugar in the beer, the initial stages of fermentation can be quite vigorous, which can result in higher temperatures than desired and has the potential to induce the dreaded foam explosion[1].  Considering the particulars of the fermentation for this style of beer, I felt it would be great to get a few of my the sensors hooked up to it.

While we were brewing, I started assembling the sensor unit.  I didn’t have everything I needed on hand, as I have been stashing my electronic projects at my girlfriends place.  So I borrowed an Arduino and breadboard from my roommate, and got everything setup.  The only issue I can potentially see, is that I am using a 10K pull up resistor instead of a 4.7K.  Not sure if this has any impact on the calibration at all.  Something worth looking into later.  After a long brew day however, I was in no shape to work on the code base, so I called it a day and went to sleep.

Getting the code working with a second sensor wasn’t too complicated.  The DS18B20 allows for multiple temperature sensors to be run off of the same Arduino pin.  Because they are digital sensors, they each have a unique address.  So I modified the Arduino code to return the unique sensor address in addition to the temperature.  On the server side, I simply stored the data into separate files based on the sensor address, and then added a separate view that sent along both of the data sets to be plotted together.

TempSensorsx2

Two temperature sensors after a few days of data collection.

While the modifications were fairly straight forward, I did stumble upon some issues that will probably have to be dealt with.  By updating the Arduino sketch, I also had to update the sensor server to handle the new data.  This broke the functionality of the original sensor unit.  And because this unit was at my girlfriends place, I had no way of updating the code on the Arduino[2].

The other issue has to do with the temperature sensor addresses.  While it is convenient that you can run multiple sensors off of the same pin, it is pretty difficult to figure out which address corresponds to which sensor.  In my case I was using one sensor to monitor ambient temperature, and another to monitor the fermentation temperature.  I made a lucky guess, and got the assignment right on the first try.  But I could see this being an issue with more sensors.  Making matters worse is that the address for each sensor is a 16-bit hexadecimal serial number, which is difficult to memorize or write down and enter into a terminal or web form.  Considering the type of application we are using this for, I think it might make more sense to run the sensors off of different pins, and then use the pin numbers as a way to identify which sensor is which.  I doubt the extra pin space will be missed, and this would make it much easier for the user to identify the sensors.

SensorOutput

Example Output from the sensor unit. Which sensor is which? Hard to tell from the unique HEX addresses.

Outside of these minor issues, the sensors have already proven there worth.  The brew session was without issue and we ended up with a very active fermentation.  I was around for most of the day when this occurred, so I was able to monitor the situation and make adjustments accordingly (pulled out the blow off tube off, and left the bucket lid partially ajar to prevent any explosions).  But if you look at the graph above, it shows how the fermentation temperature rose from 65-66F to 70-71F[3].  Had I been out of the house, checking the temperature would have alerted me to these potential issues.  And now that the fermentation has been settling down, the main concern is keeping it warm enough.  With temps dropping to ~65F, I will soon need to start adding some heat to the process to keep the fermentation from stalling out.

  • A hectic day filled with brewing, drinking, and tinkering. Here is a shot of the 'work(brew)bench'. Paper towels used to good effect to prevent any spills or splashes from causing too much damage.

The project is still very much in ‘beer code’ phase (quite literally), there is no database on the backend, I am just copying and pasting html templates to create the different pages for the different profiles, and the sensor-to-server system is hacked together and very fragile.  But all-in-all, I think it is a good proof of concept, and a good starting point for making a more robust application.  Time permitting, i will try and solidify the code a bit more, and I have a few more features that I want to add, so hopefully I will have some more updates on the project soon.  Cheers!

[1] Iv’e mentioned this phenomenon in a previous post.  It occurs when foam (a.k.a krausen) from the fermentation clogs the airlock or blow off tube which prevents CO2 from escaping the fermentation bucket.  As pressure builds up, the lid to the bucket will eventually blow off resulting in a big mess.

[2] I am still looking into the options, but it looks like I might be able to use a CLI tool to update Arduino code remotely.  I will report back if and when I find a solution.

[3] I am fairly confident that the sensors are off (on the low side) by at least 1, maybe two degrees.  Not sure if this is due to the 10K resistor or what.  Mainly this is just a hunch, but partially confirmed by some very inaccurate analog thermometers.  As such, the graph doesn’t show the true magnitude of the ‘active’ period.  It was probably peeking around 72F, which is way too high for an ale.

In my last post, I went over the development of a fermentation temperature monitoring sensor using an Arduino and Raspberry Pi.  The goal of the project was build a system that would allow me to remotely monitor the temperatures of my beer fermentation.  In this post I will be discussing the server and web application portion of the project.

The code I wrote for the sensor portion of the project included a socket server program that could be used for testing the network connection between the sensor and a remote server.  This socket server code is also included in the web application code with a few small modifications.  Details on how to setup and run the code can be found in the readme.

The socket server listens for connection requests from the RasPi.  Upon receiving temperature data from the sensor, the data is appended to a csv file.  I wrote a fairly simple flask app that reads the temperature data and passes it along to the client.  I am using Flot, a JavaScript plotting library, to plot the data on the front-end.  At the moment, I have a live, working site up and running.

The project is very much in the prototype stage at the moment.  I have a few more temperature sensors on order, and as I get a better idea of how to handle the data I will start finalizing the backend and add some more features on the frontend.  In addition to handling multiple temperature sensors, I would also like to be able to specify data recording parameters from the web frontend.  While I wait for the sensors to arrive, I have been testing out the system, and have had some interesting results.

TempLoggerTest

Screenshot of Flot Chart

For the first test I simply set the sensor up in the kitchen and began recording and displaying the ambient temperatures.  A screenshot of the flot chart is above (i still need to figure out how to export flot charts as images).  Everything went smoothly with the test run.  As you can probably see, there was a brief outage on Jan 3rd.  This was because I had unplugged the sensor while clean the kitchen and forgot to plug it back in until later.

I finally got around to brewing some beer this past weekend, so was able to get the sensor hooked up to an actual fermentation.  For this brew session, I made two one-gallon batches of beer.  The standard hombrew batch size is 5 gallons, but I like to experiment from time to time with smaller batches.  For this experiment, I was making two single hop pale ales, using the exact same grain and yeast for the two beer, but using a different variety of hop in each beer. Once the beers were brewed, I taped the temperature sensor to one of the carboys and added some packaging foam to the back of the sensor to try and provide some insulation from the ambient conditions.

CascadeTemp

Cascade Single Hop Pale Ale Fermentation Profile

So if you are familiar with beer brewing, the first thing that you might notice is how high the initial temperature is.  I attached the temperature sensor right after i pitched the yeast, which means the beer was at a temperature of ~77F at the time.  Most ale yeasts prefer to be pitched into wort with a temperature in the high 60’s, so I was too hot by about 10 degrees F.  I primarily blame this hot pitch on the fact that it was getting late, and I was too tired to sit around and wait for the wort to cool more, although I did not realize how hot the wort actually was.  Of course, this also demonstrates one of the benefits of temperature logging.  By keeping a detailed record of the temperature, I get an additional and more immediate form of feedback on my brewing methods.

Another interesting aspect about the chart is the temperature fluctuations.  It has only been a couple of days, so i don’t have a lot of data yet, but it looks like the temperature is fluctuating by about 5 degrees F due to the space conditioning in the apartment.   Because this is only a one-gallon batch, the beer is probably more susceptible to ambient temperature changes than the typical 5 gallon batch.  It will be interesting to see how a 5 gallon fermentation responds, and it could mean that I need to put more effort into controlling the environment for the one gallon batches to prevent any ill affects from temperature fluctuations (according to the literature, beer prefers fairly stable temperatures).

  • Weighing out the grains. I got ~5 lbs of grain for two one-gallon batches. I split the grain in half, and used the same yeast, but used a different variety of hops in each batch. For the first batch, I used 1 oz of Cascade, and for the 2nd 1 oz of Simcoe.

One final curiosity that I came across.  I added a zoom in/out feature to the flot graphs, and when you zoom in on a small section of the plot, you can see some potential issues with the data.

LoggerIssue

Hmm, this doesn’t look right?

The Arduino sends a temperature reading to serial approximately once per second.  From there, the serial2socket.py takes the average of 60 consecutive temperature readings and sends that average across the socket connection.  So my hunch is that the temperature sensor is returning some sort of bad signal or error code every now and then, and then that signal is getting averaged in with the good data.  I will look into this further and report back on what I find.

That’s all I have for now.  I am going to start playing around with some of the flot graphs, and once the extra temperature sensors get here, I will start adding some more features to allow for better and more dynamic control over the system.  Should be fun!

So I finally got around to setting up an Arduino with a temperature sensor in order to monitor beer fermentation.  The end goal is to have a web interface in which I can remotely monitor the fermentation.

For those of you aren’t familiar with beer brewing, the fermentation temperature is a very crucial factor in the beer brewing process.  Not only does it impact the taste of the final product, but if the temperature is too warm, you can get an overly active fermentation which can result in a messy explosion.  Ideally, I will eventually add some type of temperature control system, but for now, simply monitoring the temperature is a good place to start.

For a handful of reasons, I have been sitting on this project for a while.  The concept is pretty simple, and hooking up a temperature sensor to an Arduino is very much a beginner level project.  The primary issue I was struggling with was how to send the data to the remote server.  While Arduino’s provide a quick, easy, and cheap way to start playing around with sensors, the available options for remotely communicating with the Arduino all involve some sort of trade off.  The available Arduino shields, whether it be wifi, bluetooth, or Xbee, were all pretty expensive.  The Spark Core is a nice option, but at the time, it was a little too expensive and the cloud service hadn’t been open sourced [1].  There were a few Chinese wifi chips that were floating around, but they were poorly documented and hard to get a hold of.  I had considered using some cheap RF modules, but that solution would require some sort of base station, adding to the cost and complexity.

In the end, I decided to simply hook up the Arduino to a Raspberry Pi.  I have a few Raspberry Pi’s sitting around that I use as servers.  Hooking them up to the Arduino was just a matter of plugging in the USB cable and reading the serial output.  I think in this case, I was letting the ‘perfect be the enemy of the good’.  I can always continue to research the other options and make adjustments as new or better options become available.  But for now, I am sticking with the Arduino -> RasPi -> Server solution.

The parts list is pretty simple, links and prices provided:

So all in, the parts list comes out to ~$70.  Of course your cost’s will vary depending on what else you need to buy.  If you were starting from scratch, I am not sure I would recommend this setup.  As mentioned, the main reason I went with this setup was because I already have a few RasPi’s sitting around, so my costs for this project were around $15.  It should be noted that using the RasPi as part of the fermentation monitoring setup does not impact my ability to continue to use them as servers, I simply setup separate tmux sessions for each application.  So if you already have a RasPi sitting around, this is a good option to get things up and running quickly.

Another issue I ran into was my initial choice of temperature sensor.  I was originally using the TMP36, a cheap analog temperature sensor.  It was working fine on the bread board, but when I soldered some extension wires to it, the signal got very jumpy.  After some research, it turns out that you need do do some serious signal filtering when using analog sensors with long extension wires.  I played around with adding some resistors to the circuit to clear up the signal, but eventually decided to spring for digital temperature sensor (the DS18B20 listed above).  On a tangential note, one of the downsides to hardware projects (as opposed to software), is if you find yourself in need of parts or components for your project, you can loose a lot of momentum if you have to wait for them to ship to you. In this case, I ordered the temperature sensor form dx.com because it was cheaper and came with free shipping.  The catch was that it was shipping from Asia and took over a month to arrive, which killed the momentum on the project considerably.  Definitely something to keep in mind for future hardware focused projects.

  • Beer Explosion!!! Fortunately I was working from home this day, so I caught it early, but this is what happens when you get an overactive fermentation. The airlock get blocked up with foam, the pressure builds (notice the bulging lid), and eventually blows the lid off, possibly covering your walls with beer! Using a blow off tube can help prevent this (although isn't a guarantee).

Once I had a working arduino/temp sensor combo, it came time to write the code.  For a simple project like this, there is plenty of sample Arduino code that will do exactly what you need.  I personally prefer to try and write the code myself using the tutorials and example code as a guide.  Often time the resultant code will end up looking pretty similar to the example code, but I think it provides a much better learning experience to at least attempt to do it yourself.

The Arduino code was pretty straight forward.  Using the One Wire libarary for Arduino, I was able to piece together an Arduino sketch that read the data from the sensor, converted the data to a temperature value, and then printed the temperature to serial output.  Before this project, I have only played around with analog sensors, so working with a digital sensor was a nice change of pace.

OneWire ds(pin);
//...//
ds.select(addr);
ds.write(0x44, 1);  // send conversion instruction
delay(1000);
present = ds.reset();
ds.select(addr);
ds.write(0xBE);  // read data from scratchpad

With an analog sensor, you simply read the voltage from the signal wire, and then use a formula to convert that signal into some form of data.  One wire digital sensors require two commands to get the data.  The first command ds.write(0x44, 1); instructs the sensor to perform an internal conversion and write the data to a scratchpad (a small piece of RAM on the sensor). In order to give the sensor time to perform the conversion, we issue a delay(1000), and then finally we read the data with ds.write(0xBE);. The ds.select(addr); is used to address a specific device. The cool thing about these sensors is that you can daisy chain them (which is why you need the select command), so when I get more time I will definitely be exploring this because it would be nice to have multiple temperature sensors running off the same Arduino. That way I can monitor the ambient temperature as well as additional fermentation vessels.

After uploading the sketch to the Arduino, I got started on the Python code.  Since I was using a RasPi to interface with the Arduino, it would have been easy enough to simply read the data from the serial port, and then set up a Flask server on the RasPi that could be accessed from the internet.  However, I eventually would like to add a handful of additional temperature sensors to the project, possibly in different locations, so I felt it was a good idea to learn about and tinker with socket programming in python.

The code for this project is available on github. The Arduino sketch is located in the tempsensor directory (tempsensor.ino).  The sketch can be uploaded to the Arduino using any computer that has the Arduino IDE, and once the sketch is loaded, the Arduino can be hooked up to the RasPi (you do not need to install the Arduino IDE on the Pi, the Arduino will start running the Sketch once powered via the usb).  The serial2socket.py program is run on the RasPi, and will pull the temperature data from the Arduino and send it over the network using a socket connection.  The socket_server.py program is primarily for testing purposes.  The program can be run on a second computer or server and used to verify that the RasPi is sucessfully sending the temperature data across the network.  See the repo readme for more information on setting up and running the code.

While I have played around with the try/except pattern in python before, socket programming relies heavily on the pattern due to the potential connection issues that are typical when communicating across a network.  In order to handle these potential issues, I wrote my own custom error handler.

def error_handler(errmsg, message, stop=True):
    """
    Handle Errors for main function
    errmsg: the exception error message
    message: additional message
    stop: default=True, stops exectution of code
    """
    message += " Error Code: " + str(errmsg[0]) + " - " + str(errmsg[1])
    print message
    rightnow = str(datetime.datetime.now())
    logging.debug(rightnow + ": " + message)
    if stop:
        sys.exit()

In order to ensure some robustness in the program, it was necessary to allow the program to continue running after a failed connection attempt. I choose to implement a simple counter that tracked the number of consecutive failed attempts, and if there were 10 failures in a row, exit the program. The error handler allows me to specify whether to exit the program or not, and i can also pass custom error messages that are then printed to the log. That way I can keep an eye on any issues that might be cropping up and make adjustments to the heuristic as necessary. So far, my tests have been running pretty smoothly though.

As I mentioned previously, the socket_server.py code is primarily meant for testing purposes. I am currently working on another git repo that will contain more robust socket server code as well as the web application code. The reason for keeping these repos separate is because I will probably be updating the application code fairly frequently, and having a bunch of copies of the application code sitting on the sensors isn’t really necessary.

That’s all I have for now.  I am pretty excited about this project.  One of my goals is to eventually turn the sensor-server communication into a full blown API with an authentication system and rate specifications (so you can specify how frequently you want to send/update the temperature data).  I will be posting about the web portion of this project shortly, so stay tuned.

[1] Since I originally evaluated Spark’s offerings, they have released a cheaper chip, the photon, and have opened sourced their cloud software.  Something to keep in mind for future versions of this project.