In my last post, I went over the development of a fermentation temperature monitoring sensor using an Arduino and Raspberry Pi. The goal of the project was build a system that would allow me to remotely monitor the temperatures of my beer fermentation. In this post I will be discussing the server and web application portion of the project.
The code I wrote for the sensor portion of the project included a socket server program that could be used for testing the network connection between the sensor and a remote server. This socket server code is also included in the web application code with a few small modifications. Details on how to setup and run the code can be found in the readme.
The socket server listens for connection requests from the RasPi. Upon receiving temperature data from the sensor, the data is appended to a csv file. I wrote a fairly simple flask app that reads the temperature data and passes it along to the client. I am using Flot, a JavaScript plotting library, to plot the data on the front-end. At the moment, I have a live, working site up and running.
The project is very much in the prototype stage at the moment. I have a few more temperature sensors on order, and as I get a better idea of how to handle the data I will start finalizing the backend and add some more features on the frontend. In addition to handling multiple temperature sensors, I would also like to be able to specify data recording parameters from the web frontend. While I wait for the sensors to arrive, I have been testing out the system, and have had some interesting results.
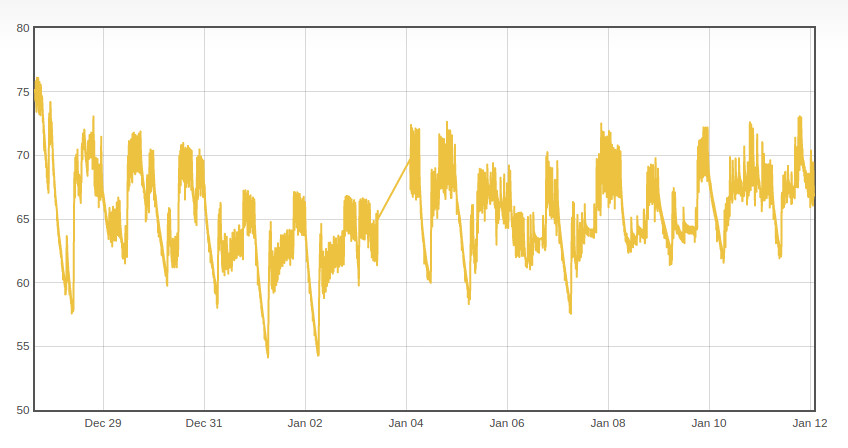
Screenshot of Flot Chart
For the first test I simply set the sensor up in the kitchen and began recording and displaying the ambient temperatures. A screenshot of the flot chart is above (i still need to figure out how to export flot charts as images). Everything went smoothly with the test run. As you can probably see, there was a brief outage on Jan 3rd. This was because I had unplugged the sensor while clean the kitchen and forgot to plug it back in until later.
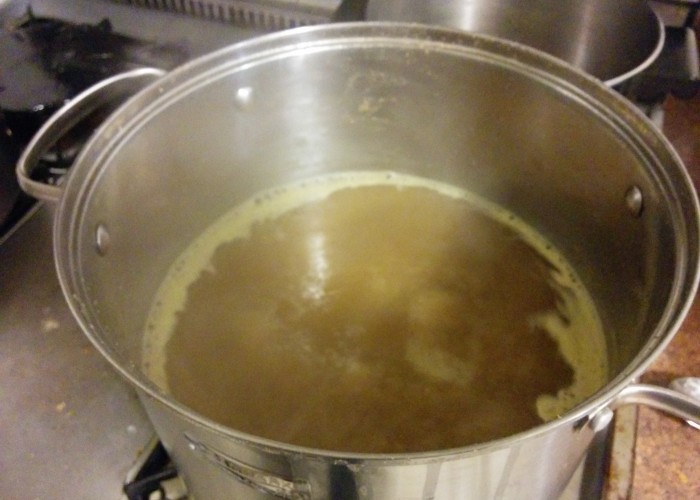
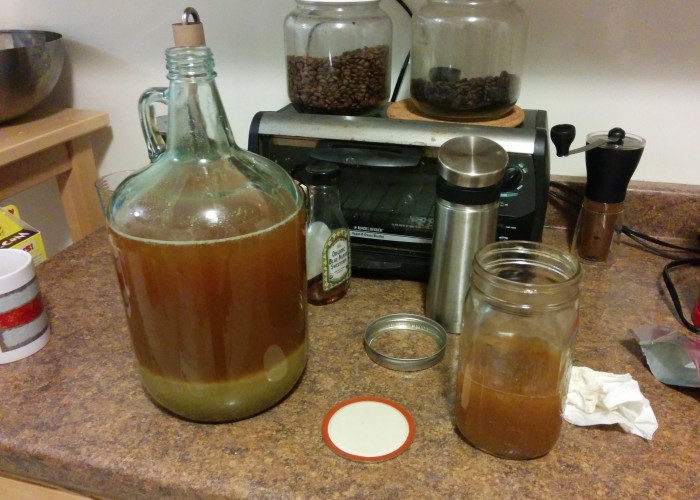
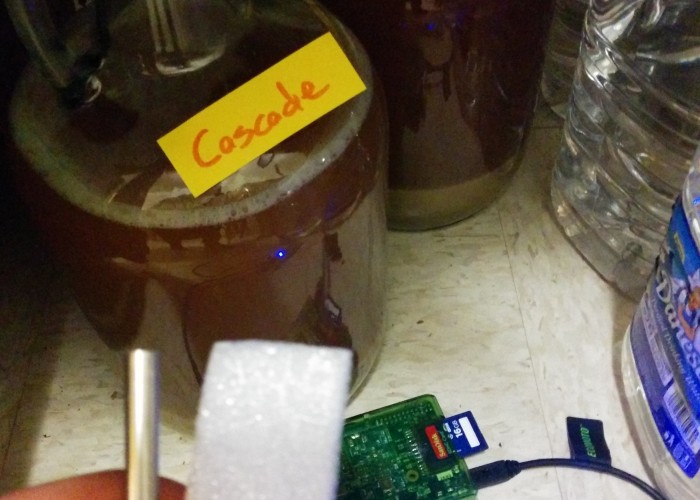
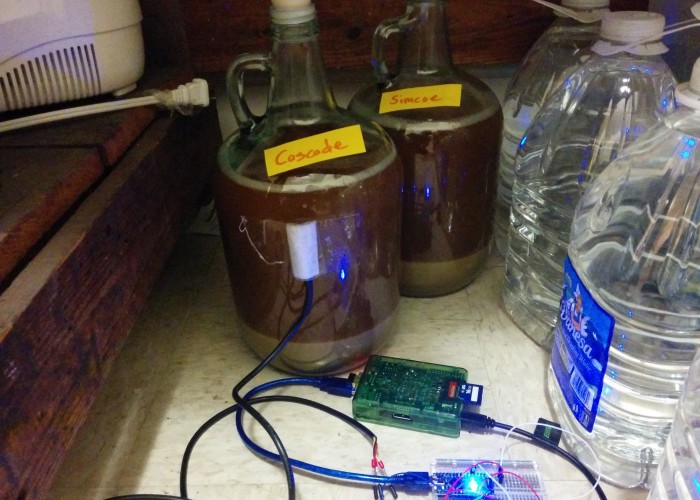
I finally got around to brewing some beer this past weekend, so was able to get the sensor hooked up to an actual fermentation. For this brew session, I made two one-gallon batches of beer. The standard hombrew batch size is 5 gallons, but I like to experiment from time to time with smaller batches. For this experiment, I was making two single hop pale ales, using the exact same grain and yeast for the two beer, but using a different variety of hop in each beer. Once the beers were brewed, I taped the temperature sensor to one of the carboys and added some packaging foam to the back of the sensor to try and provide some insulation from the ambient conditions.
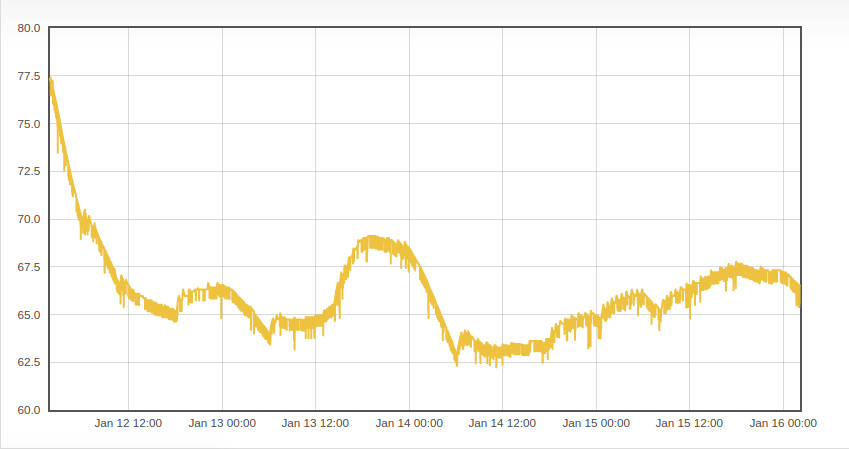
Cascade Single Hop Pale Ale Fermentation Profile
So if you are familiar with beer brewing, the first thing that you might notice is how high the initial temperature is. I attached the temperature sensor right after i pitched the yeast, which means the beer was at a temperature of ~77F at the time. Most ale yeasts prefer to be pitched into wort with a temperature in the high 60’s, so I was too hot by about 10 degrees F. I primarily blame this hot pitch on the fact that it was getting late, and I was too tired to sit around and wait for the wort to cool more, although I did not realize how hot the wort actually was. Of course, this also demonstrates one of the benefits of temperature logging. By keeping a detailed record of the temperature, I get an additional and more immediate form of feedback on my brewing methods.
Another interesting aspect about the chart is the temperature fluctuations. It has only been a couple of days, so i don’t have a lot of data yet, but it looks like the temperature is fluctuating by about 5 degrees F due to the space conditioning in the apartment. Because this is only a one-gallon batch, the beer is probably more susceptible to ambient temperature changes than the typical 5 gallon batch. It will be interesting to see how a 5 gallon fermentation responds, and it could mean that I need to put more effort into controlling the environment for the one gallon batches to prevent any ill affects from temperature fluctuations (according to the literature, beer prefers fairly stable temperatures).
-
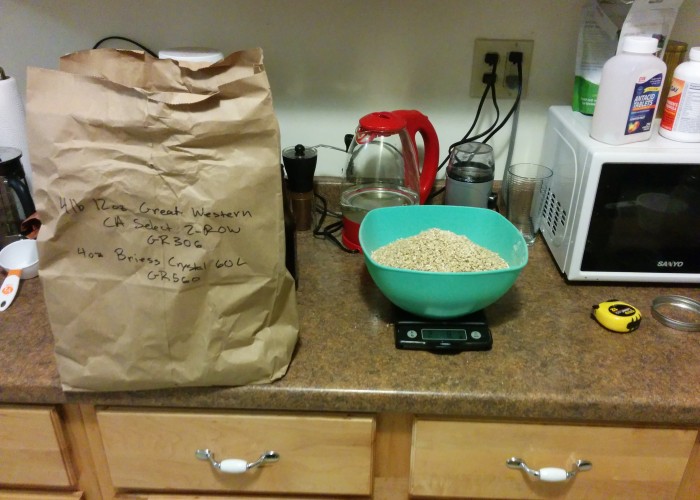 Weighing out the grains. I got ~5 lbs of grain for two one-gallon batches. I split the grain in half, and used the same yeast, but used a different variety of hops in each batch. For the first batch, I used 1 oz of Cascade, and for the 2nd 1 oz of Simcoe.
One final curiosity that I came across. I added a zoom in/out feature to the flot graphs, and when you zoom in on a small section of the plot, you can see some potential issues with the data.
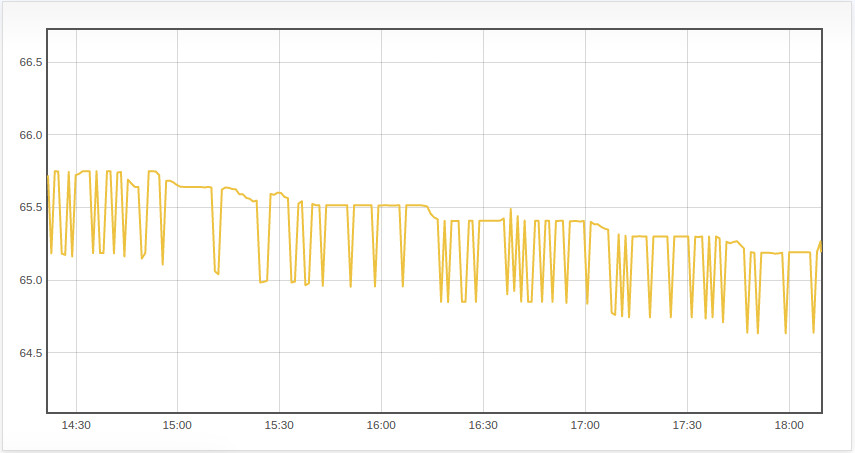
Hmm, this doesn’t look right?
The Arduino sends a temperature reading to serial approximately once per second. From there, the serial2socket.py takes the average of 60 consecutive temperature readings and sends that average across the socket connection. So my hunch is that the temperature sensor is returning some sort of bad signal or error code every now and then, and then that signal is getting averaged in with the good data. I will look into this further and report back on what I find.
That’s all I have for now. I am going to start playing around with some of the flot graphs, and once the extra temperature sensors get here, I will start adding some more features to allow for better and more dynamic control over the system. Should be fun!